
Time energy profile
The treatment of wastewater requires a number of different processes, but the exact methods employed to perform these processes is not the same at all sites. There are a number of different ways to treat wastewater so what is presented here may not represent exactly what happens at the WWTW case study site but does represents a typical plant. A more accurate representation could be made with more site-specific information which could be part of a further more detailed investigation.
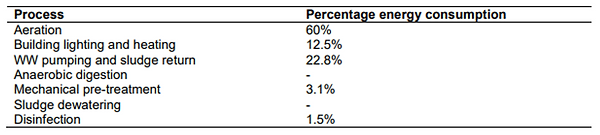
Although there is no exact configuration for a WWTW a rough breakdown of energy consumption for the different processes within a typical site is given in Fig.7, with this figure taken from a 2019 paper by Capodaglio and Olsson. (13) This considers the percentage of a plant’s energy consumption required for each of the processes at a WWTW giving typical values and ranges.

WWTP energy consumption breakdown
As discussed in section “Energy required to treat wastewater” section Scottish Water consider sludge treatment separately in the numbers they provide in their sustainability report. (6) Therefore, here the sludge treatment will also be considered separately from the treatment of wastewater, but both be included in the site’s total energy. Expanding on this, Scottish Water identifies wastewater treatment as representing 31% of their electricity demand with sludge treatment, comprised of anaerobic digestion and sludge dewatering, representing 14%. (6)
Scaling these figures, it will be assumed wastewater treatment requires 68.9% of a WWTW’s electricity demand and the treatment of sludge the remaining 31.1%. This equates to 239.4MWh and 108.1MWh per year, respectively, at the WWTW case study site. Aeration is the most energy intensive process and Scottish Water identifies this as requiring 60% of the energy needed to treat wastewater. Taking this 60% value for aeration and scaling the other four processes across the remaining 40% using the values from Fig.7, an estimation of the energy consumption breakdown is found as shown in Table 2. The figures given in Table 2 relate to the 239.4MWh needed to treat wastewater with the 108.1MWh required for sludge treatment again considered separately.
Assumed energy consumption breakdown for different waste water treatment process at Scottish Water WWTW
Before attributing a given quantity of energy for each of these processes some considerations need to be made. Previously it was assumed that a unit volume of wastewater requires 0.7055kWh of energy to treat. But this included the treatment of sludge that will be considered separately and comprises 31.1% of this energy. Therefore, excluding the treatment of sludge, the energy needed to treat a unit volume of wastewater is 0.4861kWh.
Building lighting and heating then makes up 12.5% of this energy needed to treat wastewater, however this is independent of the volume of wastewater being treated. Therefore, this heating and lighting demand is removed and spread evenly across the year to create a constant baseline energy demand. Taking 12.5% of the 239.4MWh annual energy requirement for treating wastewater and spreading this evenly across the year a constant energy consumption of 3.416kWh for building heating and lighting is found. There may be variations in this demand, particularly the heating across the year or across a day that could potentially be modelled, but for this investigation that is unnecessary, and a constant value will be used. Note, as the building lighting and heating demand has been assumed to be constant the quantity of energy needed to treat each unit volume of wastewater has reduced by 12.5% to 0.4254kWh.
Adding to this baseline the assumption will be made that the sludge treatment takes place on site. This is a long continual ongoing process (14) and will not be included in the efforts here to shift loads but considered as a consistent background demand. Therefore, evenly spreading the 108.1MWh needed annually on site to treat sludge gives an hourly energy demand of 12.34kWh. Combining this with the building heating and lighting demand it is therefore assumed that the WWTW case study site consumes a minimum baseline of 15.76kWh per hour irrespective of the volume of water passing through the plant. Interestingly, and coincidently, this is exactly the same minimum value discussed in section 2.2 where the possibility of the plant running on minimum power was considered.
Now taking the 0.4254kWh required to treat a unit volume of wastewater, excluding sludge processing and the building heating and lighting which have already been considered, the energy for the four remaining processes can be calculated. These values are presented in Table 3 and from this a time energy profile can be constructed. This involves attributing these energy values to the relevant time within the water’s journey through the treatment plant. To achieve this the time the wastewater spends in the WWTW will be divided into one-hour segments which each process now considered in turn.
WWTW process and the energy required for each process per m3 of waste water treated, excluding building lightingand heating, anaerobic digestion and sludge dewatering which are considered seperately

The two simplest processes to deal with are mechanical pre-treatment and disinfection. These will be taken to occur in the first and final hour segments, respectively.
Following the mechanical pre-treatment, the wastewater is pumped to the primary clarifier where the sludge is collected and taken for sludge treatment. As with nearly all wastewater treatment processes there is no set standard time for primary clarification. The Food and Agriculture Organisation of the United Nations (FAO) describes this as taking 2 to 3 hours, (14) but Scottish Water report this process as taking 6 hours within their operations. (15) This process will be assumed to take 6 hours, but it should be noted that this value is at the upper end of the scale.
This is followed by the aeration process which takes between 5 and 8 hours and will be assumed to take 6 hours. Next a secondary clarification takes place, assumed to last 2 hours, with a final disinfection occurring before the water is pumped into the sea or into a river. (14)
The entire process is therefore assumed to take 14 hours with the aeration process being the most energy intensive. The wastewater pumping and sludge return is difficult to accurately place within this 14-hour journey so it will be assumed that this is evenly spread across the water’s time in the plant. This is a fairly big assumption but the critical component to consider for this model is the aeration process as this will drive the attempts to match demand with supply.
The values for the wastewater pumping and sludge return and aeration given in Table 3 must therefore be divided across 14 hours and 6 hours, respectively. This all combines to give the energy time profile given in Fig.8 and Table 4 which quantifies and attempts to visualise how much energy is needed to treat a unit volume of wastewater for each hour of its time in the plant.

Assumed time energy profile per cubic meter of wastewater passing through a typical WWTW
Assumed time energy profile for a unit volume of wastewater passing through a typical WWTW
Although the time energy profile shown in Fig.8 might not be exactly what’s happening at the WWTW case study site, it shows what typically happens at WWTWs and highlights the most important feature with the majority of the energy demand being required for aeration which occurs a number of hours after the water has entered the plant.