
Export Potential
Quantifying the ‘Lost’ Energy
The next question to ask is, what to do with the recovered energy? The two options available to water utilities are export and sell the energy or use the recovered energy within their operations. But how much energy exactly is currently being lost? Understanding this will help identify the value of this energy and its potential applications for water utilities. Here we will consider our Scottish Water case study and look to estimate the total energy dissipated throughout the entire network.
There are a number of ways to achieve this with the ideal scenario being real time flow data at the inlet and outlet of all the PRVs in the network. But as a first approximation a much simpler method can be used considering the entire network as a single system, with a single flow rate and a single pressure drop.
Scottish Water delivers 1.46 billion litres of water to customers daily. (1) This equates to an average flow rate of 16.9m3 per second. This value does not include the leakage of 465m litres per day within the network. (2) The exact points in the network where this water is lost is difficult to identify, and therefore the energy this water dissipates through PRVs is hard to estimate. For this reason and the ongoing efforts to further reduce leakage in the future, this factor will be ignored. Additionally, friction in the pipes will remove energy from the water, but this too will be ignored.
Whereas the flow rate was taken from Scottish Water’s published data, an average pressure drop is considerably harder to approximate.
In an attempt to estimate this value as a first approximation, Scotland’s four largest cities, Aberdeen, Dundee, Edinburgh, and Glasgow, were considered. Table 1 gives the site and elevation of each city’s main WTW, the average elevation of the city, and the difference in height between the two. An average height difference of 98m was found. Note this value is not weighted based on the size of each city’s population or the quantity of water each WTW supplies, it is purely an average, and four data points is limited, therefore although a value of 98m will be used there is significant uncertainty with this value. Additionally, this just takes the height of each city as a single value and as the end point of the water’s journey whereas there will be height variation within each city and water will be delivered to customers in outlying towns on its downhill journey. This value is simply a best estimate to gauge the scale of the energy lost and potential for recovery.
Height difference between the major water treatment works and the city to which they deliver water for Scotland’s four largest cities

Assuming the water is delivered to the customer with a pressure of 1bar, that is, a 10m head height pressure, the average head height pressure that is removed by PRVs will be 88m. (15) An estimate of the average continual power lost in the Scottish water network through all the PRVs can now be found using equation 1 with an average flow rate of 16.9m3 per second and a head height of 88m used. (16) This gives an average continual power loss of 14.55MW.
P = QρgH
Where: P = power (W)
Q = flow rate (16.9m3/s)
ρ = water density (997kg/m3)
g = acceleration due to gravity (9.81m/s)
H = head height (88m)
Taking this value of 14.55MW, this can be checked for reasonableness against other studies. There is thought to be a potential 2GW of capacity for energy recovery systems within the drinking water network across the European Union (EU). (17) Scaling down this value based on population it can be compared to the calculated value found using equation 1. It is unclear whether the 2GW value includes the United Kingdom, but for this check it will be excluded. Therefore, taking an EU population of 447.7m and a Scottish population of 5.454m, it can be seen Scotland has a population of 1.218% of the EU. Then 1.218% of the 2GW potential EU capacity equates to 24.36MW. This value is higher than the 14.55MW value calculated, and it would perhaps be expected that Scotland would have a higher-than-average capacity due its hilly geography. However, the value for Scotland is an average and not the capacity. Considering the diurnal effect of the variation in flow rate, which is discussed in more detail below, the peak capacity will be higher and in line with what would be expected.
This value of 14.55MW is the average power dissipated and so the total energy lost through PRVs annually can be found by multiplying this by 8760 hours, giving a total annual energy loss through all PRVs in the network of 127.5GWh.
But how much of this energy is viable for the purposes of generating energy to export?
Viable Energy Resource
Of the 127.5GWh of energy dissipated annually, how much of this will be accessible is dependent on a number of factors with one of the most significant being the cost, but the cost is then also highly dependent on the size of the site in question and how much power it dissipates. Therefore, it is necessary to know how this 14.55MW is dissipated across each of the PRVs across the network.
Scottish Water has around 4500 PRVs, again the best method would be to use the real time inflow and outflow data for all of the PRVs as there is significant variation in the size of these devices and the quantities of water and the pressures they manage. But an assumption of how the energy is dissipated across all of the PRVs can be made with some backwards engineering. The largest sites are thought to dissipate around 92kW, but the majority are likely to be small and below 5kW with the average being 3.23kW. A roughly exponential decay was assumed and for a first approximation the following distribution shown in Fig.1 was taken.
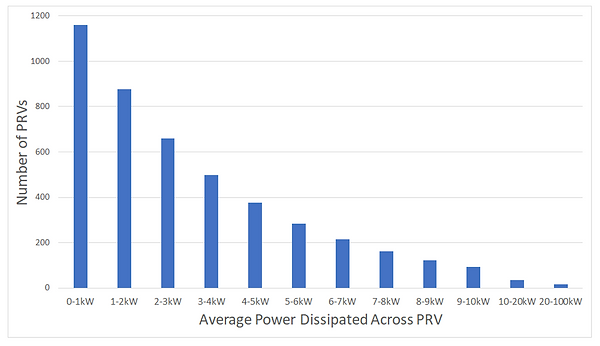
Estimated distribution of how much power is dissipated on average across the 4500 PRVs in the Scottish water distribution network.
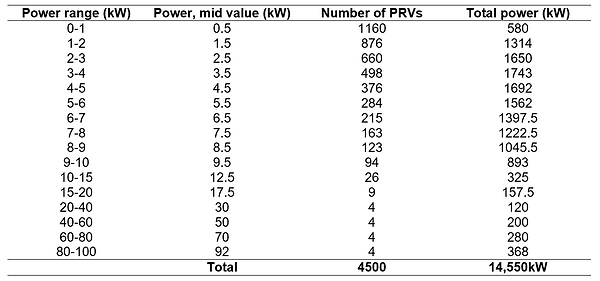
Table 2 shows a more detailed breakdown of the categorisation with the total power column found by multiplying the number of PRVs and the mid power value for that size category.
Estimated distribution of average dissipated power for all PRVs in the Scottish Water network.
Previous studies have considered the energy recovery potential from the water network in Wales and Ireland. For this work a feed in tariff of 15-22p/kWh was found to allow sites above 4.8kW to be potentially financially viable and with a rate of 7.2p/kWh this increased in size to sites over 24.8kW. (18) Considering the assumed distribution shown in Fig.1 and Table 2, it is clear that cost has a significant factor in how much of the potential energy within the water could be accessible to export. As things stand there are no favourable green rates in Scotland with the UK FIT ending in 2019. (19) Therefore, any power that is generated through energy recovery systems would have to be sold on the wholesale market where prices can vary significantly making the option export currently unviable without government support to help grow and develop this technology. However, to assess the potential benefits of these systems we will consider the scenario where there is sufficient government backing and a favourable feed in tariff to allow for a more in-depth investigation.
Up to this point only the energy dissipated through the PRVs has been considered but any attempts to capture this energy will be subject to losses. The efficiency in harvesting this energy will be taken to be 65%, although in reality the efficiency will be dependent upon the choice of turbine and the variation in the flow rate. (20) Using this simple assumed single value, the annual energy that could be extracted drops from 127.5GWh to 82.88GWh.
Considering a 65% efficiency and that sites over 4.8kW could be financially viable we can estimate the export potential from recovered energy within the water network. Table 3 was created to achieve this, which is an amended version of Table 2, with the power values adjusted assuming a 65% efficiency and the sites below 4.8kW discarded for being economically unfeasible.
Estimated power that could be harvested through each PRV site assuming a 65% efficiency and discarding values below 4.8kW.

Therefore, of the 14.55MW of power dissipated throughout the network, 2.71MW across 432 sites may be accessible with a favourable tariff rate, equating to 23.7GWh of the total 127.5GWh dissipated annually through PRVs. If this process is repeated using the 24.8kW value associated with the lower tariff rate in Ireland only 0.55MW of the power would be available from 12 sites, potentially generating 4.8GWh annually highlighting the sensitivity to cost This only indicates those sites that may be feasible and other factors such as grid connection and flow variation would need to be further investigated on a case-by-case basis.
The previous study into the energy recovery potential at PRV sites in Wales and Ireland found a potential average power output of 0.98MW and 8.6GWh of energy that could be harnessed annually from PRV sites. (18) The 23.7GWh value calculated for Scotland should be considered against this work for reasonableness. Although Ireland and Wales combined have a combined population of 8m compared to Scotland’s 5.5m and a significantly smaller potential according to the previous study at 8.6GWh there are several factors to consider. Firstly, the value for Scotland was calculated using only the higher FIT rate rather than a mixture used in the previous study which included the lower rate. Additionally, this work went beyond that of this project. With access to more data and information about the sites investigated the concluded value considered only the most appropriate sites, factoring in issues such as flow variation at given locations and implementation of the system. With these points in mind, the calculated value for Scotland seems reasonably as an initial estimate for the potential energy for sites that could be utilised and should be further investigated for technical feasibility, with this shortlisting process likely to reduce the total energy potential to a value closer to that found by the study into this potential in Ireland and Wales. (18) It should be considered a starting point on which to conduct more detailed analysis.
Diurnal Flow and Energy Pattern
Up to this point the power and energy calculations have used an average flow rate. In reality the flow rate through the network and the PRVs will generally follow a diurnal pattern with peaks in flow during the morning and evening with extended low flow rates at night. Therefore, to properly assess the potential of energy recovery within the water network this pattern must be considered.
A diurnal water flow pattern for an average home was taken to calculate how the power output would change throughout a standard day. (21) Although this isn’t an exact representation of the entire network it does provide a reasonable approximation and highlights general trends. This pattern was taken and used to calculate how the average potential power of 2.71MW would vary across a day. A peak capacity of 6.01MW was found with power available falling to almost zero at night as shown in Fig.2 as the demand for water drops significantly.
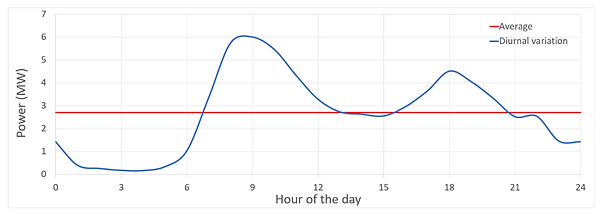
Diurnal variation of potential power output.
The daily demand in electricity, shown in Fig.3, follows a similar pattern to that of the potential from energy recovery systems shown in Fig.2. (22) Although not an exact match this is an important and valuable aspect of these energy recovery systems. They generally produce electricity at times of increased demand. Therefore, although the capacity of such a system may be limited at 6.01MW it could prove a useful asset in that the electricity that is produces is predictable, reliable and is generated at times of increased demand.
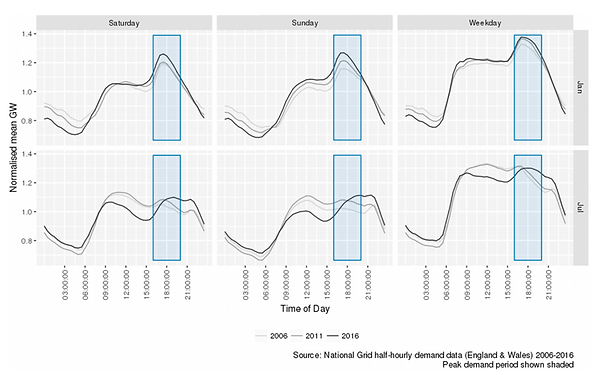
Mean hourly energy demand, weekdays vs weekend days, January vs July, England and Wales, 2006, 2011 and 2016.
Potential Barriers
Although there may be potential to generate energy for export through energy recovery at PRV sites throughout the network, there are a number of critical barriers that hinder the development and deployment of this technology at scale. Using drinking water and the water network to power turbines is a relatively new concept that may have potential issues such as reliability and pressure transients. Water utilities are likely to be hesitant to put untested systems into their critical infrastructure. Additionally, those sites that will initially be cost effective will be the larger sites dissipating the most energy. But these sites will be the most important to the water network with huge volumes passing through, often supplying water to entire cities. Water utilities will not risk this infrastructure, but without utilising these sites that will initially be most cost effective, the technology and confidence to employee turbines within the network will fail to develop. However, is there an alternative?
Another possible use of this energy could help develop the use of energy recovery and bring about an array of sustainable benefits. When the aim of the energy recovery is more than just a simple financial payback through selling electricity a number of opportunities emerge. Could recovered energy within the water network be used to help power a smart water network? And what benefits could this bring?